| Back
to . .
.
 Curve
Bank Home Curve
Bank Home
Curve
Index
Deposit #81
Louis A. Talman
Dept.
of Mathematical and Computer Sciences
Metropolitan State University
of
Denver
____________
<>
Talman
created individual images for the Quick Time Movie using
|
|
|
|
|

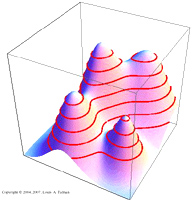
How to Visualize a Contour Map ~
This section . . . .
from . . .
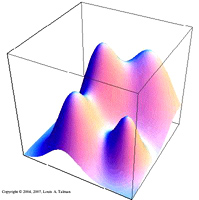
from a
three-dimensional representation . . . . . . . .
|
to
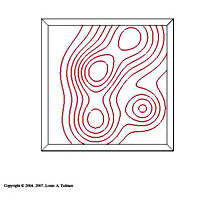
to a planar curve
or map.
|
|
 2007 2007
|
Did you know . . .
Contour
curves, also known as topographic maps, have an enormous number
of applications in applied mathematics. Mining and oil
exploration, weather maps, contours of temperature (isotherms) and
pressure (isobars) are a few examples. Basically, these curves or
maps are a way to display three-dimensional features on a planar
surface.
References that
should
be in most university libraries.
|
Gray,
Alfred, Modern Differential Geometry of
Curves and Surfaces with MATHEMATICA®, CRC Press,
1998, p. 300.
|
McQuarrie,
Donald A., Mathematical Methods for
Scientists and Engineers, University Science Books, 2003, pp.
234-235.
|
Hughes-Hallet,
Gleason, McCallum, et al., Calculus,
Single and
Multivariable, 4th ed., John Wiley
and Sons, 2005, Section
12.3, pp. 618-629.
|
Stewart, James, Essential
Calculus: Early Transcendentals,
Thomson:Brooks/Cole, 2007, pp. 594-595.
Stewart, James, Calculus: Early Transcendentals 5e ed.,
Thomson:Brooks/Cole, 2003, p. 893.
Stewart, James, Calculus 5e
ed.,
Thomson:Brooks/Cole, 2003, p. 929.
|
|
|
The
National Curve Bank
thanks Lou Talman for Deposit #81.
[email:
talmanl@gmail.com ]
|
|
|