|
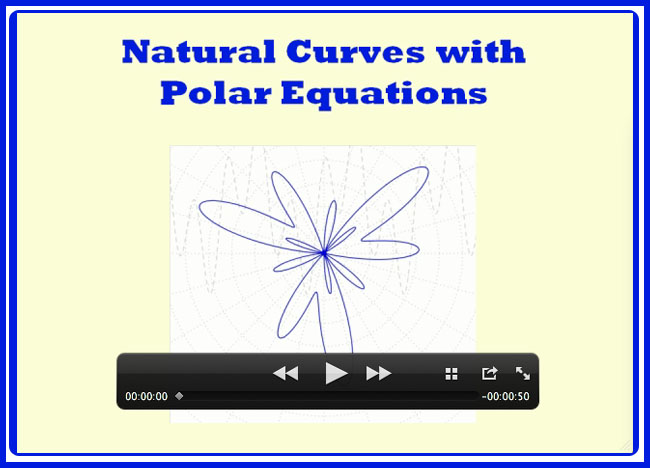
The following animations offer a
comparison of polar and Cartesian graphing.
Graphing
calculators and computer software permit construction of complicated
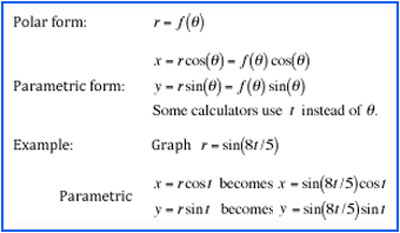
graphs within seconds. However, one must often take a polar
equation and write it in
parametric form. If your grapher does not have a
built-in polar graphing command, then take the polar equation and write
as follows:
In GeoGebra it is easy to alter all variables and constant terms while
watching the dynamically changing curve. Finally, it is possible
to watch an animation using color.
|
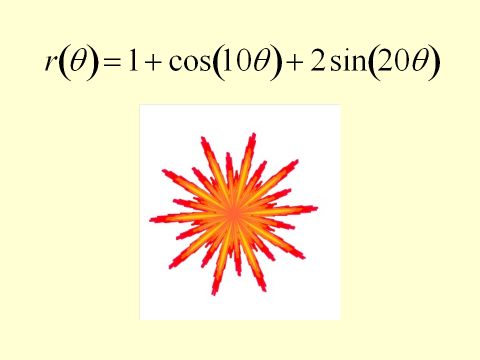
Click on the
image
to see the
equation. |
 |

|

|
|
 |
 |
|
|

|
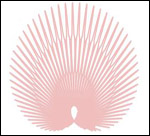
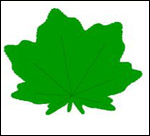
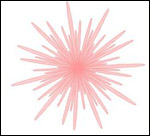
These
curves are
created with GeoGebra, a free software that allows users to work with
Algebra, Geometry, Trigonometry, Statistics and Calculus. They
are graphs of polar functions of the form
where a, b, and c are real numbers and i, k, and m are positive
integers. Some of these graphs are not obtainable on hand-held
graphing calculators with lower resolution displays. Slides 7 and
8 are rotated 90 degrees counterclockwise from the original graphs.
|
|