| Back to . .
.
Deposit #120 |
 The Classic Volume of a Box Problem . . . extended to Exponential Regression |
 |
This same set of data may be used as an Excel exercise. 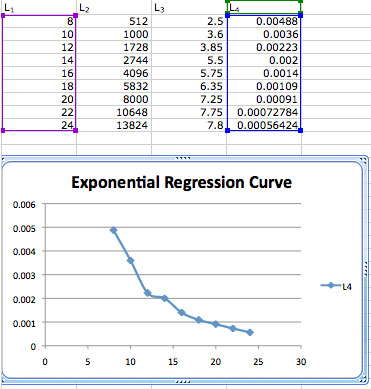 |
| A
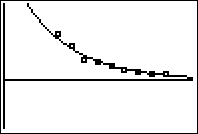
Comparison of the two graphs invites closer inspection of the
data. Note the increment between $3.60 to $3.85 and $5.50
to $5.75 is the same, but also the smallest of the entire data
set. This produces a "kink" in the curve. The graphing calculator was programmed to produce a smooth curve; whereas "Excel" simply connects the points. Interesting! For more ideas and activites see the following: Coll, Davis, Hall, Magnant, Stankewicz and Wang, "Integer Solutions to Box Optimization Problems," The College Mathematics Journal, MAA, Vol. 45, No.3, May, 2014, 180-190. |
A
quick and interesting graphing calculator
application of exponential regression.
application of exponential regression.
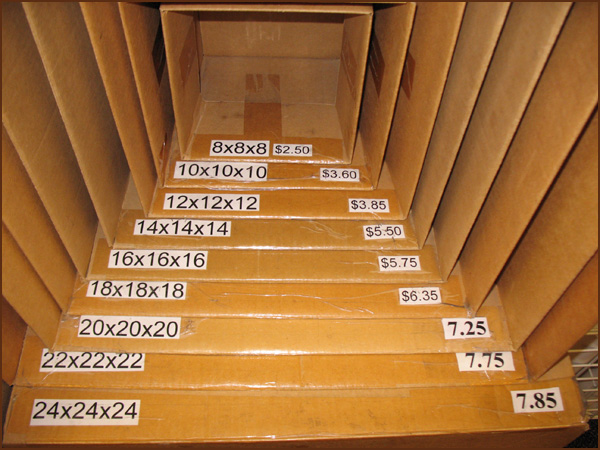
Virturally
all students in advanced algebra
and calculus have solved a "volume of the box" problem. This
activity uses boxes and a graphing calculator to illustrate
exponential regression.
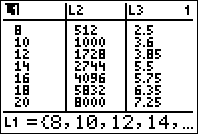
L1 is the list of one dimension of each box.
L2 is the cube of L1, or the volume of each box.
L3 is the cost of each box.
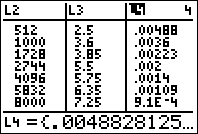
L4 is the average cost per cubic inch or
L2/L3.
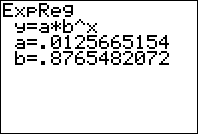
After plotting the points ( L1, L4 ) . . . , and noting the curve,
After plotting the points ( L1, L4 ) . . . , and noting the curve,
we determine the exponential regression equation.