Back to . . .

Curve Bank Home

Wavelets Part II

Wavelets: Applications


Deposit # 65

Slide show on  wavelet analysis

Illustrative applications


             Data Analysis:
Titles of data analysis categories


MAA logo


Dr. Van Fleet's  Wavelets and Applications:  A Multidisciplinary Undergraduate Course on Scientific Computing
is one of the MAA 2006 Professional Enhancement Programs.   He will present this material at MathFest 2006.


The Haar Wavelet Transform
and
Digital Images

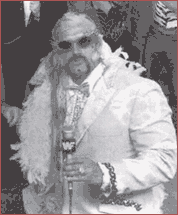
Begin with any random image:
  Image modification

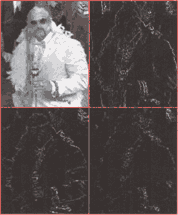
and then apply a "HWT" transformation to the image.
HWT applied to image
The upper left quadrant is the approximate of the original image, while the upper right, and lower quadrants represent only the vertical, horizontal and diagonal details of the original.

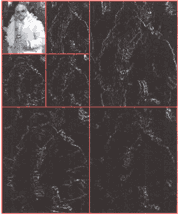
.....and then apply a second "HWT" transformation to the previous iteration.
Another HWT transformation


"Clearly, there is much freedom in choosing an application.

The 'correct choice'  depends upon the selection, and belongs to the 'art' of mathematics."


For matrix algebra in
MATHEMATICA® -

More wavelets button
NCB logo
Wavelets - An Introduction

Patrick Van Fleet, University of St. Thomas, St. Paul, MN
NSF DUE-0442684

The mathematics of classical "Fourier Analysis" has many applications in business, science, engineering and medicine.  However, when there are discontinuities in the derivatives of a function, or there is a need for better "time frequency" information, the new field of Wavelet analysis has most attractive - often superior - features.  Wavelet Analysis may thus be considered as an extension or refinement of the much older Fourier Analysis.

One of the nice things about wavelets is it is very new math.  Most argue that wavelets have only been around since the 1980s.  This is quite different from much of the mathematics we typically learn in college.

Van Fleet makes use of wavelet theory by constructing discrete wavelet transformations to handle data compression, edge detection, and signal de-noising.  He has developed materials for undergraduates using MATHEMATICA®  and MATLAB  for ad hoc constructions.  Thus, his modeling has the immediate impact desirable for undergraduates.


To illustrate these ideas, begin by examining  . . . . .
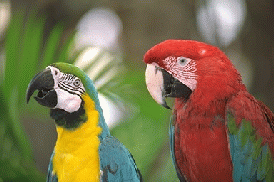
Comparison of images #1 Comparison of images #2 Comparison of images #3
A copy of the original image with


149604 bytes of information
and a transfer time of
5.00 seconds on a standard modem.

A wavelet compressed copy of the original image with

12253 bytes of information
and a transfer time of
0.40 seconds on a standard modem
(about 8% of the original size).
A second wavelet-compressed version of the original with

4452 bytes of information
and a transfer time of
0.15 seconds on a standard modem
(about 3% of the original size).
Obviously, there are only scant differences in quality, but the savings in time and size are significant.    These images come from a fascinating site developed by Osmar R. Zaïane at the University of Alberta, Canada. The NCB recommends you take a look at other images and make similar adjustments using his wavelet controls.
< http://www.cs.sfu.ca/CC/365/li/material/cgi-bin/wavelet.cgi >

Why Compress an Image?

According to Gonzalez and Woods, (Digital Image Processing,  2nd ed., Prentice Hall, 2002), compression is achieved by removing onr or more of the following redundances.
  • Coding Redundancy - The codes used to store information about each pixel is not optimal.
  • Interpixel Redundancy - Exploit the fact that nearby pixels in an image are often related to each other.
  • Psychovisual Redundancy - Remove information that is typically ignored by the human eye.
Basic Compression Algorithm
  • If appropriate, convert the image to a color space more amenable to eliminating psychovisual redundancies.
  • Transform this image to a new image.  This transformation will exploit interpixel redundancies and result in an image whose energy is stored in a small area.
  • Encode the transformed image.  The encoding scheme takes advantage of the fact that the energy of the transformed image is highly concentrated and produces short codes to represent the image information.
  • Transmit the image.
Image Basics
  • For the purpose of this explanation, we will only consider "grayscale" images.
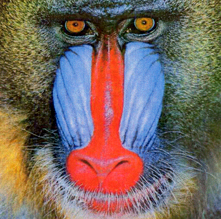
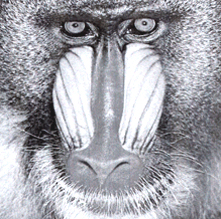
    Color image vs grayscale image
    Color image vs grayscale image
    Think of a grayscale image as a matrix where each element is an integer ranging from 0 to 255. We assign 0 to be black and 255 to be white.
    Grayscale illustration
    Each integer between 0 and 255 is assigned a character. These characters (bytes) are the standard characters as assigned by the "ASCII" code, or the American Standard Code for Information Interchange. As luck would have it, there are exactly 256 characters on a standard keyboard.
    Students of mathematics recognize that 256 = 28. Thus we can express each character (byte) as a base two number comprised of only eight 0's and 1's.
    For example the ASCII number  121  is  "y"  on the keyboard and in base two is
    Base two explanation
    Thus every intensity could be stored as an eight-bit stream.  The dimensions of our baboon image are 512 x 512  so the total number of bits needed to store the baboon is  5122 x 8 = 2,097,152.
Background for Huffman Coding
In 1952 David Huffman made a simple observation:

Rather than use the same number of bits to represent each character, why not use a short bit stream for characters that appear often in an image and a longer bit stream for characters that appear infrequently in the image?

He then developed an algorithm to do just that.  We refer to his simple algorithm as Huffman Coding.  We will illustrate the algorithm with an example.

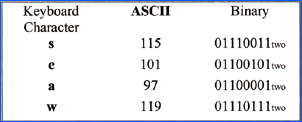
Suppose you want to perform Huffman coding on the word  "seesaws."     First observe that  "s"  appears three times  (24 bits),  "e"  appears twice  (16 bits), and  "a"  and "w" each appear once  (16 bits).  Thus, the total number of bits needed to represent "seesaws" is  56.  Here is the ASCII and binary representation of each letter:
ASCII scale
So in terms of bits, the word "seesaws" is
01110011011001010110010101110011011000010111011101110011
The first step in Huffman coding is based on probabilities:  Assign a probability to each character and then sort from smallest to largest.  The probabilites are in circles called  "nodes" and then connect them with lines (branches).
Assignment of probabilities to "seesaws"

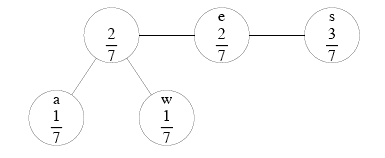
Now simply add the two smallest probabilites to create a new node.  Branch the two small nodes off this one and resort the three remaining nodes.
Tree modifications with probabilities
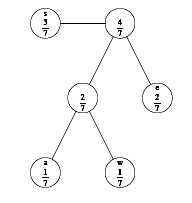
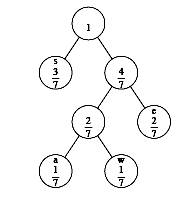
Repeat the process by adding the two smallest probabilites on the top row, and then create a new node with everything below these nodes as branches.  Sort again.  When only two nodes remain on the top, simply add the probabilities together to get the 1 and a finished tree.
Continued tree modifications and more modifications
Another tree diagram
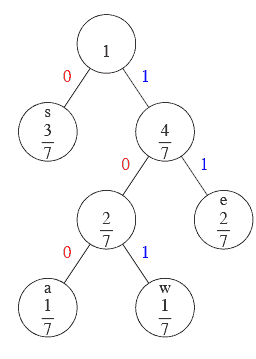
Now assign to each branch the value  0  and to each right branch the value of 1.

We can read the new bit stream for each character right off the tree!  This is the new bit streams for the four characters:

Keyboard
Character
Binary
s
0two
e
11two
a
100two
w
101two
The  "s"  apprears three times in "seesaws" so we need 3 bits to represent them.  The character  "e"  appears twice (4 bits), while both  "a" and  "w" appear only once  (3 bits).  The total number of bits we need to represent  "seesaws"  has been reduced from the original  56 bits to only 13. Using the Huffman codes for each character we now write:

Probability final and "seesaws"

References

[1]      R. C. Gonzalez and R. E. Woods, "Digital Image Processing",  2nd ed., Prentice Hall, 2002.

[2]     C. K. Chui, “An introduction to wavelets ”, Academic Press, San Diego, 1992.

[3]     W. Dahmen, Multiscale problems and methods in numerical simulations, CIME  Summer Course, 2001
           < http://www.igpm.rwth-aachen.de/dahmen/cime/ >.

[4]     I. Daubeschies, “Ten lectures on wavelets ”, SIAM, Philadelphia, 1992.

[5]      Mark W. Drew and Ze-Nian Li, "Fundamentals of Multimedia", Prentice Hall, 2003.

[6]     A. Gelb and E. Tadmor, Detection of edges in spectral data, To appear in Applied and Computational Harmonic Analysis.

[7]    S. Mallat, “A wavelet tour of signal processing ”, Academic Press, 1998.

[8]    
E. J. Candes, Harmonic analysis of neural networks, Appl.Comput.Harm.Anal., 6 (1999), 197-218.


Links
University of St. Thomas Center for Applied Mathematics
          <  http://cam.mathlab.stthomas.edu/wavelets/  >

Osmar R. Zaïane, University of Alberta, Canada
          < 
http://www.cs.sfu.ca/CC/365/li/material/cgi-bin/wavelet.cgi  >

Fourier Series:  Oscillating Harmonic Vibrations

          < http://www.tfh-berlin.de/%7Eschwenk/hobby/fourier/einzelbilder.html  >

Center for Wavelets, Approximation and Information Processing, National University of Singapore

          < http://www.cwaip.nus.edu.sg/demo/wdic.htm >

The Engineer's Ultimate Guide to Wavelets
          <http://engineering.rowan.edu/%7epolikar/WAVELETS/WTtutorial.html > .

Another Introduction to Wavelets
          < http://www.amara.com/IEEEwave/IEEEwavelet.html >


MAA logo
Home button
Wavelets Part II:  Compression Mathematics

Wavelets Part III:  Applications
Comparison of JPEG vs. Wavelet Images


2007