| Back to . . . .
|

The Gaussian Distribution
|
|
|
The Gaussian
Distribution, also called the Frequency Curve, Bell Curve, or Normal
Distribution, is one of the most widely studied topics in all
mathematics. Two of the
most common variations of the equations are . . .
As a probability function:
|
As the
so-called Standard Normal Distribution:
|
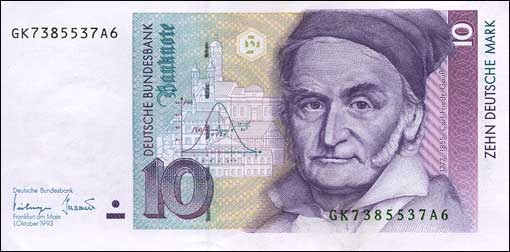
The Deutsche Mark
note with Gauss' picture and his hallmark distribution curve has been
replaced in circulation by the Euro.
|
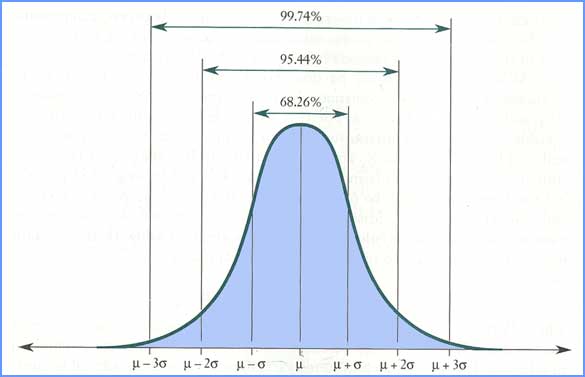
The strength of the Gaussian Distribution is that it is often a very
good approximation. This assumption is based on the Central Limit
Theorem studied in the Calculus. The "CLT" proves that the mean
of any data set, with a distribution having both a finite mean and
finite
variance, tends to be Gaussian. This implies that test scores,
height,
weight, etc., when graphed will tend to have a "bell" shape, with very
few
at either the high or low end.
|
|
From Roger
Thatcher's
address to the BSHM Christmas meeting on December 13, 2003:
Re: Thatcher's employment as a statistician in the Ministry of
Labour
or Department of Employment.
| "I made some
analyses
of the earning statistics and eventually produced two papers for the
Royal
Statistical Society. One interesting result concerned the
earnings
of manual men. These followed a lognormal distribution.
That
is to say, the logarithm of their earnings has a normal distribution,
which
is now sometimes called the Bell curve (though earlier it was known as
the
Gaussian distribution, originally discovered by de Moivre). There
had
been earlier surveys of manual earnings at various dates right back to
1886
and these had been lognormal too. What was extremely unexpected,
though,
was that these lognormals all had almost exactly the same variance.
This
meant that although the level of earnings had changed enormously since
1886
in terms of £ per week, the percentage differences between higher
paid
and lower paid workers had hardly changed at all. I remember that
one
day a whizz-kid from Downing Street came round to tell us that there
was
going to be a brand new incomes policy, which this time would change
the
distribution of earnings. I said: 'Well, it is a lognormal
distribution.
What shape do you want it to be?' " |
|
References
< ..//famouscurves/famous.htm#FrequencyCurve
>
|
Click here for
a view of the spread of a Normal Distribution.
|
Weisstein, Eric W., CRC
Concide Encyclopedia of Mathematics, CRC Press, 1999, p. 716.
|
| For Mathematica®
code that will create many variations of this curve see Gray,
A., MODERN DIFFERENTIAL GEOMETRY of Curves and Surfaces with
Mathematica®, 2nd. ed., CRC Press,
1998, pp. 393-394. |
|
|